By Abigail Gilson-Beck and Julio Ferreira – Designers of geomembrane-lined containment facilities commonly assume two to five leaks per hectare, with each leak of the size or diameter of a few millimeters. A leak is any damage that fully penetrates a geomembrane panel or seam (e.g. hole, perforation, tear, crack or puncture). Typical leaks caused by equipment placing cover material can be orders of magnitude larger than what is typically assumed in design, and may compromise the project. The ASTM D7007 is the standard practice used throughout the world for electrically locating leaks in installed covered geomembranes. For over a decade, this standard has virtually not changed, although significant advances in technology have occurred.
LEAK DETECTION DISTANCE, ASSESSMENT, BLIND LEAKS & MORE
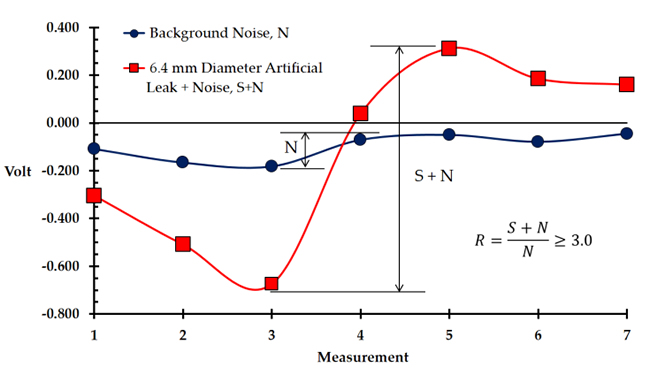
With ASTM D7007, the success of a survey relies on the Leak Detection Distance (LDD) test. This test is performed by measuring voltage at some offset from a real or artificial leak, both with and without the leak in place. When the leak is not in place, the measurements are considered to be quantifying the “background noise” intrinsic to voltage measurements of the cover material. When the leak is in place, the measurements are considered to be quantifying the “leak signal,” which includes the “background noise” in the voltage measurements of the cover material.
ASTM D7007 determines that the magnitude of the “leak signal” of the leak must be at least three times the magnitude of the signal from the “background noise” in the LDD test. The ratio of the “leak signal” to the “background noise” is referred to as the “R” value, which is taken to be an indicator of the leak detection sensitivity of the site. A larger number should indicate greater sensitivity. A graph is usually created for these measurements in order to verify that the target leak is producing a signal resembling the characteristic sine-wave pattern of a leak in the geomembrane.
ASTM D7007 specifies two types of procedures for the LDD test: an artificial leak and an actual leak. The annexes of ASTM D7007 specify procedures for using actual and artificial leak devices in LDD tests. In both cases, the leaks are placed just before the start of the dipole survey, which does not simulate the conditions of existing leaks in the geomembrane with soil coverage and water flow through the leak for days or weeks since placement of the material covering the geomembrane after installation and the setup of the dipole survey.
The use of an artificial or actual leak just before the dipole survey by the dipole operator has to be done ensuring good contact of the conductive material covering the geomembrane, so one can check the suitability and sensitivity of the dipole survey. Thus, a successful LDD test does not guarantee that real leaks in the geomembrane are going to be detected under the site conditions. An artificial leak constructed and placed per ASTM D7007 can exemplify excellent “contact,” which is not always the reality for every actual leak throughout the site. An actual leak can have better or worse contact than the artificial leak and the signals produced by leaks with varying contact conditions can vary by several magnitudes. The signal produced by a leak is much more a function of its electrical contact than the actual leak size. If the contact is not good, the leak may not be detectable at all.
Site owners may also test to verify the likelihood of success of a dipole survey for making a blind, actual leak in the geomembrane to check the capacity of the operator to find it without knowing its location. However, due to the large number of parameters that can affect a survey, site owners are not usually aware of the restrictions and the technical steps to make a blind leak that is conformant to the limitations of the dipole method. Nevertheless, if the technical limitations are taken into account in the execution of blind leaks, it is more appropriate to make a blind leak at the time of installation of the geomembrane than conducting LDD tests with an artificial or actual leak as per ASTM D7007. This blind leak will be under similar conditions than real leaks that occur during placement of the cover material in regular construction activities.
ASTM D7909 provides a guide for the execution of blind real leaks in geomembranes. The application of this standard has solidified the general knowledge about the ability of the electrical methods to detect leaks. This standard provides procedures and explains the most important parameters in the success of detecting an actual leak: if a leak has good electrical contact, which usually means that there is adequate moisture and/or soil inside of the leak allowing current to pass through it; then the leak should be detectable. If it does not, it will not likely be detected.
Survey Performance Per ASTM D7007
Data are collected in a grid pattern throughout the survey area and analyzed for the presence of characteristic leak signals. The optimal measurement density (i.e. the spacing between readings) is obtained from the LDD test. For soil-covered geomembranes, ASTM D7007 requires data collection and analysis, but it does not prescribe how the data is to be presented and analyzed. ASTM D7007 only presents in the Appendix the description of two examples of data display with a summary of the general steps in the data analysis for each one: the Graphical Data Analysis and the Voltage Contour Mapping.
The Graphical Data Analysis Display shows voltage measurements, taken along different survey grid lines that must be manually marked using string lines or equivalent on the survey area for location reference until the leaks are identified. However, once the location references in the survey area are removed, the site owner has no means to document the precise location of the leaks in a quality control documentation.
Voltage Contour Mapping Display shows voltage measurements taken at different survey grid lines that are automatically located with high precision GPS. This voltage contour map provides easier-to-interpret quality control documentation. Leaks appear on the map as the opposite of the current injector, since current is entering the survey area through the injector and exiting the area through the leaks.

In the example (Figure 3, Right Side), the polarity of the general pattern of voltage contour values throughout the survey area created by the current injector is negative on top and positive on the bottom. Thus, the polarity of the leaks in the map is in a pattern with negative voltage on the bottom and positive voltage on the top. Leaks appear as a positive/negative pair of peaks, oriented along the direction of the dipole line during data collection (Figure 2). The peaks are separated by closely spaced contours, giving the leak signal a distinct butterfly-like shape.
Leak Location Survey Area Preparation
Proper site preparation can be summarized in the simple directive to create conditions that require the applied current to travel through the leaks only. This requires adequate electrical conductivity in the materials above and below the geomembrane and through the leaks. Site material electrical conductivity is typically enhanced by increasing its water content.
ASTM D7007 calls for isolation of the cover material from the conductive layer under the geomembrane being tested “if practical” because electric current, like water, flows into the path of least resistance. This entails making sure that any conductive features such as metal pipes are not connecting the soil covering the geomembrane in the survey area to the underlying conductive layer. In addition, the entire survey area needs to be isolated from the surrounding ground. This is achieved by creating an isolation trench around the entire perimeter of the survey area, so that a strip of geomembrane (or overlying geosynthetic) is visible around the entire survey area. This ensures that the current injected into the cover material is only able to travel through leaks in the geomembrane and not the soil around the perimeter or any conductive penetration.
ASTM D7007 Procedure Shortcomings
While the ASTM D7007 recommends for isolation of the cover material from the conductive layer under the geomembrane being tested “if practical,” this isolation of the cover material is of utmost importance. For example, the “R” value can increase by an order of magnitude by just isolating a large metal pipe in place at a job site and touching the cover material.
The requirement of a minimum arbitrary “R” value of three in LDD tests using the procedures with an artificial or actual leak recommended in the ASTM D7007 does not guarantee that the real leaks in the geomembrane in the survey area will be detected. If the LDD test is successful in detecting an artificial leak of a given diameter, it is not possible to guarantee that the survey will detect all leaks in the geomembrane of at least that size.
The ASTM D7007 does not address the uncertainties of the parameters that can influence the detection of leaks, and may create a false confidence to site owners, which are not familiar with all the technical details regarding the soil dipole method. ASTM D7909 is a guide for placing actual leaks for checking site conditions for effectiveness of dipole surveys. It summarizes the technical challenges and best practice procedures for executing blind actual leaks and actual leaks for LDD tests.
Four case studies from the United States can show with real data these basic inconsistencies with ASTM D7007 criteria and procedures.
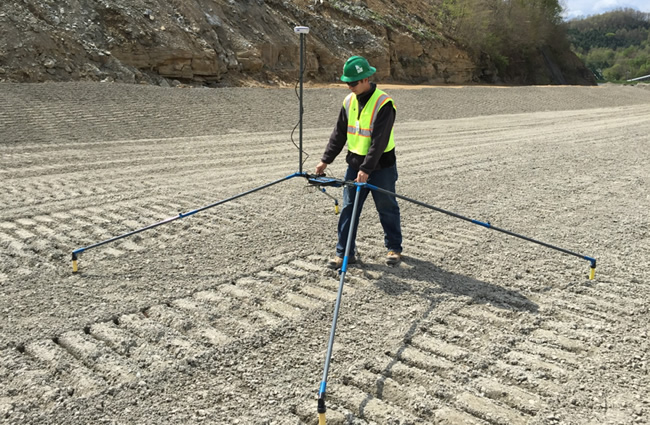
In all case studies, the first author of this article personally conducted the soil dipole surveys using a roving dipole, developed by TRI Environmental, Inc., with voltage measurement between two points spaced 3.05 m from each other along a grid line, and two parallel readings at the same time of two lines spaced 3.05 m. The measurements are automatically located with the use of a data acquisition device and high-precision GPS. Accordingly, the standard type of data analysis conducted by the authors is with Voltage Contour Mapping, which is the method utilized for the presentation of the results in this study.
LEAK LOCATION CASE STUDIES
Case Study 1: Actual vs. Artificial Leak
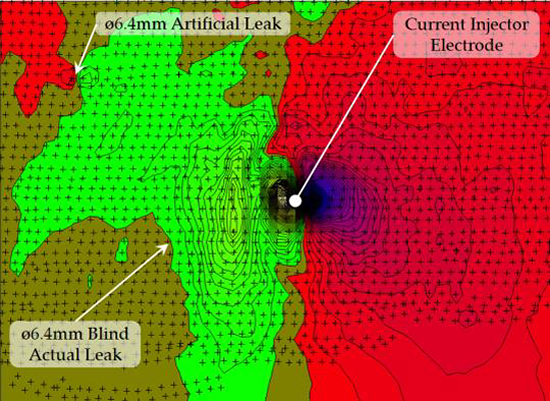
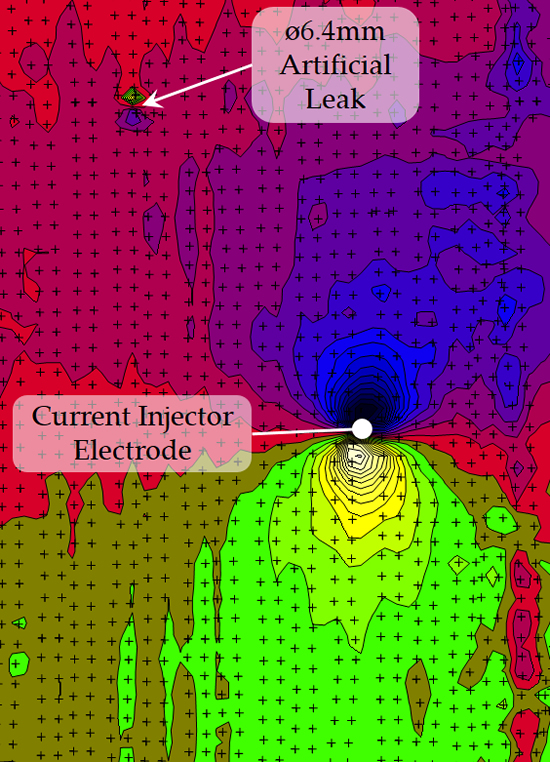
The cross section of the survey area of Case Study 1 from top to bottom is as follows: 0.6 m of gypsum cover material – 2.0 mm HDPE conductive-backed geomembrane – subgrade. Figure 3 shows the voltage contour map of the survey area containing a 6.4 mm diameter artificial leak and a 6.4mm diameter actual blind leak. Each tick mark in the map is the location of a dipole voltage reading. The current injector electrode creates the polarity with negative voltage on the right (red to blue), and positive voltage on the left (green to yellow). Thus, leaks are recognized with the opposite polarity, i.e. with positive peak to the right of a negative peak (a voltage peak is characterized by closely spaced concentric circles).
The artificial leak was easily seen on the voltage map, while the same size actual leak could barely be seen. In fact, the blind leak would not be visible at all, if voltage mapping had not been used at the site. The blind leak did not produce a detectable leak signal at its location; rather, it changed the shape of the voltage map in the corner of the survey area where it was located.
One indicator of a leak is that it polarizes the entire field behind it (relative to facing the current injector). The artificial leak strongly polarized the field behind it to a distance of approximately 23 m to the edge of the survey area . The blind leak also polarized the field behind it, but not strongly. However, the entire corner of the survey behind the blind leak was polarized to the edge of the survey area, over 60 m away. The blind leak could only be found on closer inspection of the immediate vicinity of the point at which the voltage goes from strongly positive to essentially zero.
Case Study 2: Proper Site Preparation
The cross section of the survey area of Case Study 2 from top to bottom is as follows: 0.45 m of gravel – drainage geocomposite – primary 1.5 mm HDPE geomembrane – drainage geocomposite – secondary 1.5 mm HDPE geomembrane – geosynthetic clay liner (GCL) – subgrade. The survey was conducted on the primary geomembrane.
Two 6.4 mm diameter actual leaks were created in the lining system: the first actual leak was used for LDD testing and the second one was treated as a “blind leak”. Drainage geocomposites do not naturally conduct electricity due to their HDPE geonet core and large void spaces. To conduct the soil dipole method, both the materials underneath and above the standard geomembrane must be electrically conductive. This technical challenge was overcome by completely filling the core of the drainage geocomposites with water underneath and above the primary geomembrane, so they become electric conductive material. The current injector electrode was placed in the water in the sump area during collection of the data. Nevertheless, due to the site configuration, the isolation of the material above from the material below the geomembrane was poor and negatively affected the detection of leak signals.
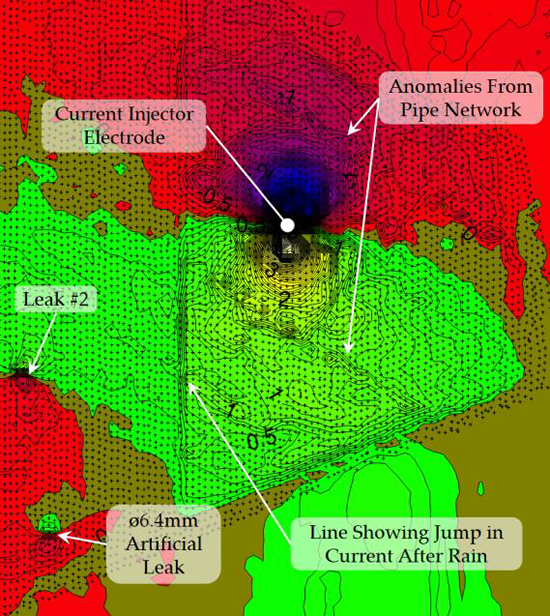
Negative values are represented by red changing to blue with increasing magnitude and positive values are represented by green changing to yellow with increasing magnitude. The positive polarity of the survey area is created by the current injector electrode located in the sump area. Leak location is recognized as a positive peak (green to yellow) directly on top of a negative peak (red to blue).
The leak for LDD testing was easy to observe on the voltage map (right side in the map), while the blind leak of the exact same dimensions was invisible (orange circle on the left side in the map).
Current leakage along the sides of the survey area was caused by an access road that was not well isolated and wet geocomposite connected to the adjacent active landfill cell. These limitations could not be fully addressed due to the site configuration and operation.
Found Leak #1 was recognized by the expected pattern of a leak signal in this site. This leak was caused by a small grain of sand or glass that created a pinhole immediately adjacent to the fusion weld. Found Leak #2 does not show this classical leak signal pattern (Figure 4a). Its signal was not strong enough to reflect the negative/positive sine wave pattern. However, significant smaller leaks can be observed in the data plotted in Voltage Contour Maps by recognizing the butterfly-like pattern, which was observed in Figure 4a and confirmed after uncovering the geomembrane at the location. This leak was caused by a small object protruding through the geomembrane with a diameter of approximately 2 mm.
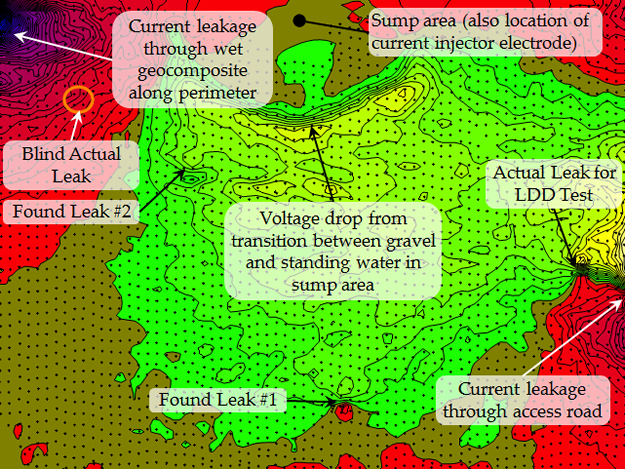
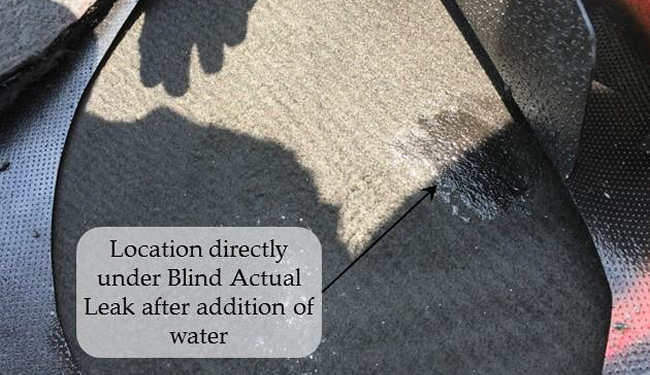
The location of the Blind Actual Leak was not detected during the survey or after analyzing the Voltage Contour Map. Its location was revisited by the dipole operator when its exact location was reported. The cover material around the location was wetted and the survey attempted immediately on top of the hole. It was still not detectable. The cover material was then removed and the dipole placed on top of the geocomposite. It was still not detectable. Water was added directly over the leak through the geocomposite until the signal became detectable. A large hole was then cut in the primary geomembrane around the hole to observe the moisture content of the geocomposite under the primary geomembrane. There was a wet spot where water had been introduced through the hole, but otherwise the geocomposite appeared dry.
Case Studies 3 and 4: Comparison of Leak “Detectability”
The cross section of the survey area of Case Study 3 from top to bottom is as follows: 0.6 m of sandy cover material – geotextile – 1.5 mm HDPE geomembrane – GCL – subgrade. The cross section of the survey area of Case Study 4 from top to bottom is as follows: 0.6 m of soil cover material – 1.5 mm HDPE geomembrane – subgrade. The Voltage Contour Maps using the same artificial leak of Case Study 3 (“R” value of 7.2) and Case Study 4 (“R” value of 17.6) are presented in Figures 7 and 8, respectively.
The ASTM D7007 bases leak detection sensitivity on the “R” value of a site. It is apparent from the review of the site voltage maps in Figure 5 and the calculation of the “R” value that the leak detection distance is not reflected in the calculation of the “R” value as ASTM D7007 suggests. The artificial leak at Case Study Site 3 with an R of 7.2 can be observed from at least 24 m away. The artificial leak at Case Study Site 4 with an R of 17.6 can barely be detected from 3 m away.
ELL RECOMMENDATIONS
The data presented demonstrate that signal to noise ratios, in the form of an “R” value as per ASTM D7007, are not necessarily a good indicator of how easy it is to detect a leak electrically. If a leak does not have good electrical contact, regardless of the size of the leak, it is not likely to be detectable.
Voltage Contour Mapping shows in one glance that a survey was performed thoroughly and correctly. Tick marks can be added to the map at measurement locations to show which areas were surveyed. It also allows leaks with weak signals to be observed, even the ones that do not show a change in polarity. It also shows where areas of current leakage are compromising the sensitivity of the survey. It provides a meaningful quality control document that can be reviewed by all parties after a succinct tutorial on how to interpret the voltage contour map.
**
Abigail Gilson-Beck and Julio Ferreira work for TRI Environmental (USA) and TRI Ambiental (South America), respectively. They presented a longer version on this topic at Geosynthetics 2017 in Santiago, Chile in October 2017. Learn more about leak location technologies at www.linersurvey.net and TRI’s geosynthetics expertise and testing services at https://tri-environmental.com and www.tri-ambiental.com.br.


