
Fouled ballast results in the degradation of mechanical properties of ballast and railway track instability. Seasonal dry-wet cycles increase the severity of the situation. In this latest addition to Geosynthetica from the GAP 2019 transportation engineering conference, Prajwol Tamrakar and Soheil Nazarian describe the use of impact load testing on clean, clay-fouled, and rock dust-fouled ballast. Their research reveals interesting differences between the impact of fouling on ballast stiffness and deformation, depending on the fouling agent, moisture, and the type of moduli used in the analysis.
1. INTRODUCTION TO FOULED BALLAST RESEARCH
Several well-documented railway incidents (Bailey et al. 2011; NTSB 2013) have been attributed to unstable tracks caused by the fouled ballast. The migration of subgrade soil into the ballast due to the dynamic train loads, crushing of ballast aggregates with time and climatic fluctuation contribute to ballast fouling (Anderson and Rose 2008; Parsons et al. 2012). Ballast fouling has a decremental effect on the mechanical properties of ballast as well (Huang et al. 2009; Duong et al. 2013; Koohmishi and Palassi 2017).
Huang et al. (2009) discussed different phases of ballast fouling and their relationships with the void spaces within the ballast. The structural stability of a clean ballast depends on the degree of contact between the aggregates. The void space within the aggregate cluster of the clean ballast also contributes to free-draining feature of ballast. With the increase in fouling, the filled voids expand and result in the loss of contact among aggregates. The major consequence of a fouled ballast is track deformation due to train loads. An increase in the moisture content of the fouled ballast causes a significant reduction in the strength and stiffness since the fouled material acts as a lubricant. Selig and Waters (1994) reported that 76% of fouling was caused by ballast breakdown, 13% by infiltration from sub-ballast, 7% by infiltration from the ballast surface, 3% from subgrade intrusion, and 1% is related to tie wear. They proposed the following two terminologies for classifying fouled ballast:
- Fouling percentage = ratio of dry weight of material passing 3/8 in. sieve to dry weight of total sample
- Fouling index = sum of the percentage of materials passing through No. 4 and No. 200 sieves
Several researchers (e.g., Han and Selig 1997; Huang et al. 2009; Parsons et al. 2012; Tamrakar et al. 2017b) have studied the characteristics of fouled ballast using laboratory tests; yet others (e.g., Roberts et al. 2006; De Bold et al. 2015; Sadeghi et al. 2018) focused on field tests for that purpose. Huang et al. (2009) used a shear box to determine the shear strengths of clean ballast and ballast fouled with coal dust, clay and mineral filler. Those authors reported the highest strength for the clean ballast. The increase in the degree of fouling resulted in a decrease in strength. The coal fouled ballast showed a significant loss of strength. For all fouled ballasts, the loss in shear strength accelerated with the increase in the moisture content.
RELATED: Permanent and Resilient Deformation Behavior of Geogrid-Stabilized and Unstabilized Pavement Bases
This paper aims to understand the effect of ballast fouling on the permanent deformation and stiffness of railway ballast. Two types of fouling agents, rock dust and clay, having different plastic indices were considered. The ballast specimens were tested with a Material Testing and Simulation (MTS) system to obtain the stiffness properties under monotonic loading, a Portable Seismic Property Analyzer (PSPA) to obtain the low-strain modulus, and a Light Weight Deflectometer (LWD) for high-strain modulus.
2. BALLAST SPECIMEN PREPARATION AND TESTING
A railway track section consisting of a ballast layer and subgrade was simulated in a container as shown in Figure 1. A detail description of specimen preparation is discussed in Tamrakar (2017).
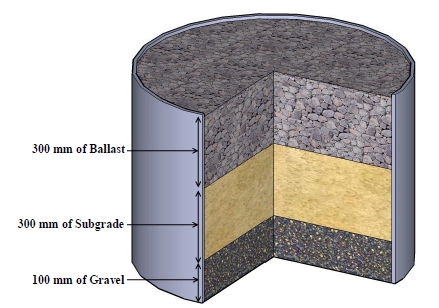
The container, which was made from a polyethylene pipe, had an inner diameter of 900 mm, height of 700 mm, and thickness of 25 mm. The material profile for each specimen consisted of 100 mm of pea gravel at the bottom, 300 mm of subgrade in the middle, and 300 mm of ballast on the top. The bottom and inner walls of the container were lined with a 150 μm thick polyethylene sheet to minimize the interaction between the geomaterials and the container walls. Based on extensive finite element analyses, Amiri (2004) found the dimensions of this specimen was appropriate for the type of tests carried out in this study. They further validated the deformation responses computed through the numerical analysis with the experimental results. The interaction between the soil and container wall based on both numerical and experimental data were negligible.
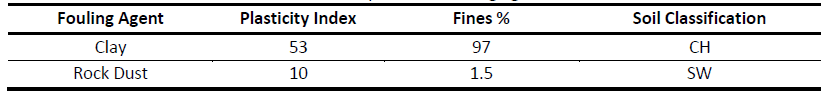
The subgrade, which was common to all specimens, was designated as SM as per Unified Soil Classification System (USCS) with maximum dry density (MDD) and the optimum moisture content (OMC) of 1794 kg/m3 and 15.2%, respectively. The limestone clean ballast, designated as AREMA 4, was obtained from a local quarry. The dry density of the clean ballast as per ASTM C29 was 1730 kg/m3. Two types of fouling agents, rock dust and clay, were used. The properties of the fouling agents, including fines content (particles passing No. 200 sieve), are tabulated in Table 1. The rock dust was obtained from the same quarry that produced the ballast. The clay was a high-plasticity clay obtained from Minnesota.
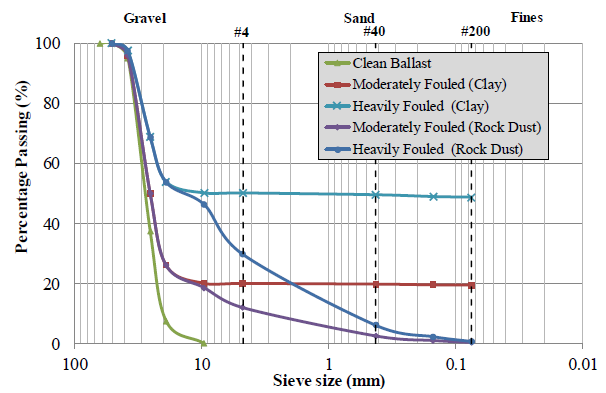
Bailey et al. (2011) indicated that the fouling percentage could reach as high as 50%. The fouled ballast specimens for this study were prepared by mixing the dry clean ballast with the appropriate fouling agents in the proportion of 20% (moderately-fouled) or 50% (heavily-fouled) by weight of clean ballast. The specimens were compacted to the nominal densities reported in Table 2. The gradations for the clean and fouled ballast specimens are shown in Figure 2. The classifications of the fouled ballast specimens as per Selig and Waters (1994) are also tabulated in Table 2.
Table 2. Properties of clean and fouled ballast specimens
Each specimen was tested under three moisture conditions: dry, saturated and partially dry (i.e., partially dried after saturation) conditions. The tests on the fouled ballast specimens prepared with the appropriate amount of oven-dried fouling materials represented the test under the dry condition. After the completion of the tests in the dry condition, the fouled ballast was saturated by introducing water from soaker hoses placed on top of the specimen. The tests were subsequently repeated in the saturated condition. The saturated ballast was left to dry for three days after the second set of tests, and the tests were repeated in the partially dry condition. After the completion of each test, moist samples were extracted to measure moisture content using the oven dry method. Table 2 shows the measured moisture content of the fouled ballast specimens.
A 1.3 MN MTS system (see Figure 3a) was used for conducting load-deformation test through a downscaled railway tie using a steel bracket. A monotonic load, up to 16 kN, was applied at a loading rate of 2.2 kN/min (see Figure 3b)
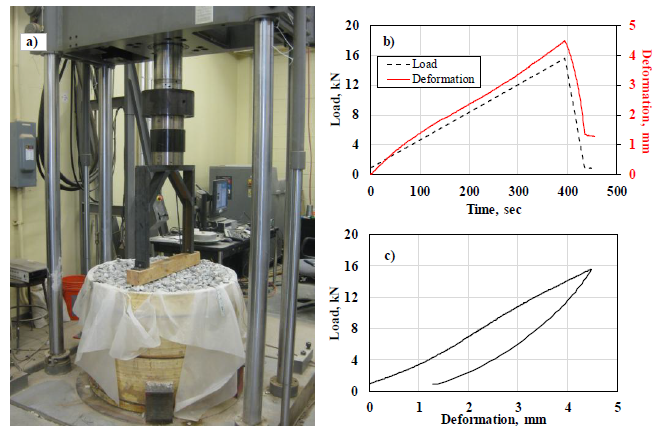
After reaching the peak load, the specimen was unloaded in one minute. The seating load of 0.9 kN was considered to have proper contact between the tie and the ballast surface. Figure 3c typical loading and unloading responses of a typical load-deformation test.
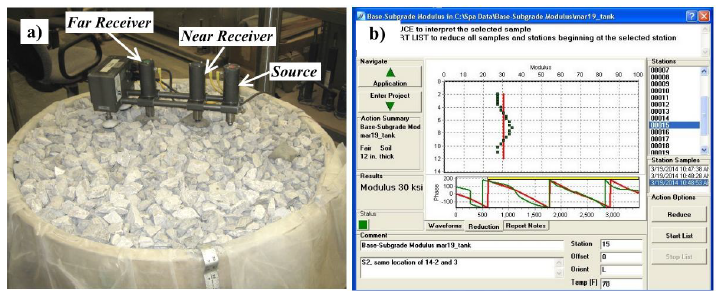
PSPA is a hand-held device for measuring stiffness parameters of pavement layers (Nazarian et al. 2003). The PSPA consists of two accelerometers and a source packaged into a hand-portable system (see Figure 4a). The source produces an impulsive impact on the material surface that generates stress waves. The signals of the stress waves are captured by two accelerometers. Using the fast Fourier analysis, the time histories captured by the accelerometers are converted into frequency-domain signals. A phase plot is developed from the frequency-domain signals (see Figure 4b). An average shear wave velocity (VS) of the material is computed by unwrapping the phase plot (Tamrakar et al. 2017a). The low-strain or linear elastic modulus (EPSPA) (termed as a PSPA modulus) is derived with Poisson’s ratio (υ) and mass-density (ρ) using:
![]() (1)
(1)
An LWD manufactured by Zorn Instruments was adopted (Figure 5) to perform tests as per ASTM E2583. For each specimen, three spots were chosen to conduct the LWD tests. The effective modulus (termed as a LWD modulus) was computed using the following equation.
 (2)
(2)
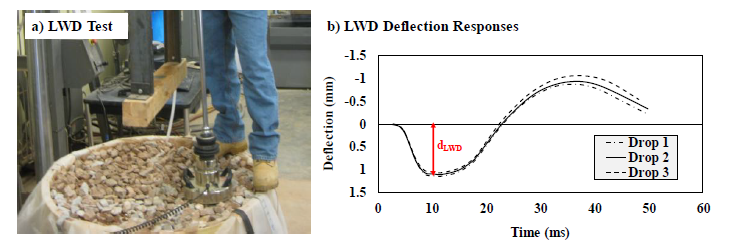
where υ = Poisson’s ratio of geomaterial (assumed as 0.4), a = radius of load plate (100 mm), F = LWD load (7.5 kN), dLWD = LWD surface deflection, and f = shape factor (assumed as 2) which is a function of the plate rigidity and soil type.
3. PRESENTATION OF FOULED BALLAST RESULTS
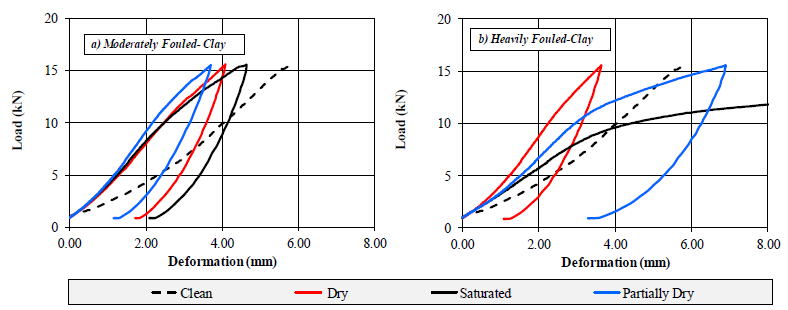
The load-deformation behavior of the clay-fouled ballast specimens at dry, saturated and partially dry conditions is presented in Figure 6. Figure 6a represents the load-deformation responses for the moderately fouled specimens whereas Figure 6b represents for the heavily fouled specimens. The black dotted curves in those figures represent the loading response of the clean ballast specimen.
Unfortunately, the unloading response was not available for the specimen with the clean ballast.
RELATED: Estimation of Soil-Water Characteristic Curves in Fouled Ballast
Compared to the clean specimen, the moderately fouled specimens deformed less, and the heavily fouled specimen deformed more. The deformation pattern of the heavily fouled specimens was exaggerated by the change in the moisture content.
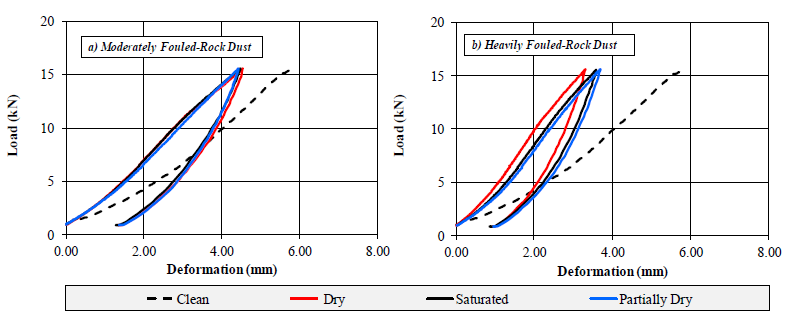
Similar load-deformation behavior of the rock dust-fouled specimens is presented in Figure 7. Both moderately and heavily fouled specimens deformed less than the clean specimen. The reduction in the deformation may be due to the presence of low-PI rock dust. The load deformation curves for the rock dust-fouled specimens is essentially independent of the moisture condition (see Figure 7).
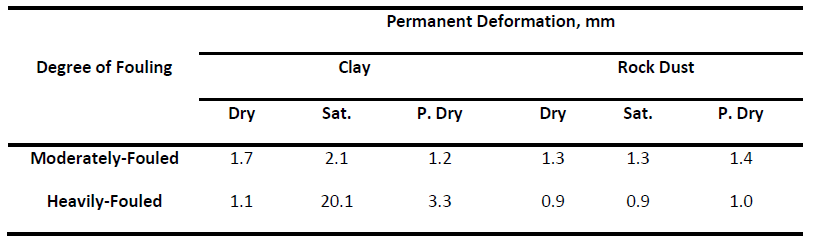
Table 3 compares the permanent deformations measured at the end of the monotonic load deformation tests on the fouled specimens. The highest permanent deformation of 20 mm was observed for the saturated heavily fouled specimens prepared with clay. Except for the saturated and partially dry clay-fouled specimens, the permanent deformations of specimens decreased with the increase in the degree of fouling. These facts indicate that the moisture and high PI fouling agents contribute to increasing permanent deformations.
The PSPA moduli of the clean, and clay- and rock dust-fouled ballast specimens are presented in Figure 8. The coefficients of variation in PSPA measurements are in the range 10% to 26% which demonstrates the heterogeneous nature of the ballast and points out to the need for more than one measurement for characterizing such materials.
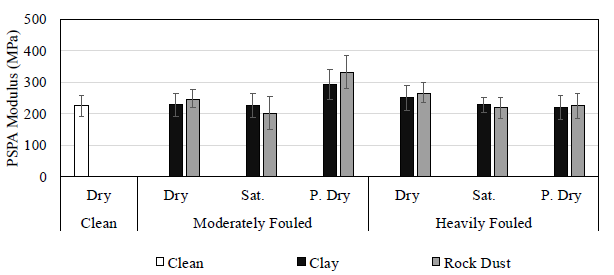
The PSPA tests of the clean ballast were only conducted under the dry condition because the free-draining nature of the material did not lend itself to saturation. For the moderately fouled specimens, irrespective of the fouling agent, the saturated moduli were less than the corresponding dry conditions.
However, as the materials dried out to the partially dry condition, the moduli increased significantly. For the heavily fouled conditions, the trend is somewhat different. Even though the saturated moduli are less than the dry ones, the moduli after subsequent drying do not increase significantly. Comparing the moduli under the dry conditions, the dry moduli increase as the degree of fouling increases. This indicates that under the dry condition, fouling might help in stiffening the track foundation. On the other hand, as soon as the fouled ballast becomes saturated it will lose its bearing capacity to some extent.
Figure 9 presents the variation in the LWD moduli of the clean and fouled ballast specimens with moisture content and degree of fouling. The average LWD modulus of the clean ballast was 41 MPa, which was significantly less than the corresponding PSPA modulus (225 MPa). The differences can be attributed to the fact that the PSPA moduli are the small-strain moduli of the ballast layer, whereas the LWD moduli are the high-strain moduli of the combination of the ballast and the softer subgrade layer below it.
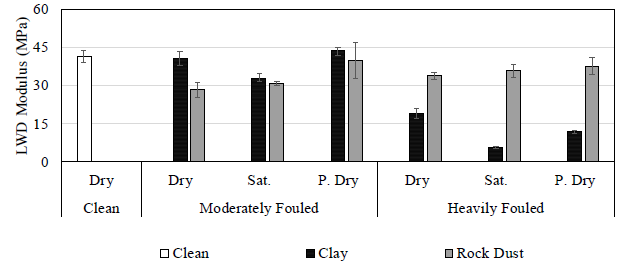
The LWD moduli for the specimens moderately fouled with clay demonstrated a pattern that is somewhat similar to the PSPA. The moduli of the specimens heavily fouled with rock dust were almost independent of the moisture condition. On the contrary, the moduli of the specimens heavily fouled with clay demonstrated sensitivity to moisture condition. Even though the moduli of the specimens moderately fouled with rock dust and clay were similar under similar moisture conditions, the moduli of the specimens heavily fouled were significantly different. Unlike the PSPA moduli from the dry conditions, a consistent pattern between the modulus and degree of fouling was not apparent.
RELATED: Geosynthetics in Diverse Railroad Applications
4. CONCLUSIONS
To understand the mechanical behaviors of fouled ballast, several specimens representing a railway track section consisting of a 300-mm-thick ballast over subgrade were constructed in the laboratory. The specimens were prepared in a container being 0.9 m in diameter and 0.7 m in height. A limestone based clean aggregate, designated as AREMA 4, was selected for preparing the ballast layer. Rock dust with a low PI and clay with a high PI, were used as the fouling agents. The ballast specimens were moderately and heavily contaminated with either the rock dust or clay. To simulate the dry-wet-dry cycles, the dry contaminated ballast specimens were saturated and then left to dry for a few days. The behavior of ballast was measured under monotonic load using an MTS system and impact load tests using PSPA and LWD.
Based on this study, the following conclusions can be drawn:
1) The ballast specimen fouled with clay (i.e., high PI fouling agent) is highly susceptible to permanent deformation. The permanent deformation is significantly accelerated by the increase in the degree of fouling.
2) The ballast specimen fouled with rock dust (i.e., low PI fouling agent) have minimal or no impact on permanent deformation. Moisture has small effects on the permanent deformation.
3) The effect of fouling on ballast stiffness is observed more from the LWD moduli than the PSPA moduli.
4) The major factor contributing to increasing railway track deformation is the combination of increasing moisture content and high PI fouling agents.
ABOUT THE AUTHORS
Prajwol Tamrakar works for Tensar International Corporation. Soheil Nazarian is with the Center for Transportation Infrastructure Systems, The University of Texas at El Paso.
REFERENCES
Amiri, H. (2004). “Impact of moisture variation on stiffness response of pavements through small scale models.” The University of Texas at El Paso, El Paso, TX.
Anderson, J. S., and Rose, J. G. (2008). “In-Situ Test Measurement Techniques Within Railway Track Structures.” IEEE/ASME/ASCE 2008 Joint Rail Conference, ASME, 187–207.
Bailey, B., Hutchinson, D., Gordon, D., Siemens, G., and Ruel, M. (2011). “Field and laboratory procedures for investigating the fouling process within railway track ballast.” Proceeding of the 2011 Pan-Am CGS Geotechnical Conference, 1–9.
De Bold, R., O’Connor, G., Morrissey, J. P., and Forde, M. C. (2015). “Benchmarking large scale GPR experiments on railway ballast.” Construction and Building Materials, Elsevier, 92, 31–42.
Duong, T. V., Tang, A. M., Cui, Y.-J., Trinh, V. N., Dupla, J.-C., Calon, N., Canou, J., and Robinet, A. (2013). “Effects of fines and water contents on the mechanical behavior of interlayer soil in ancient railway sub-structure.” Soils and foundations, Elsevier, 53(6), 868–878.
Han, X., and Selig, E. T. (1997). “Effects of fouling on ballast settlement.” Proc., 6th International Heavy Haul Railway Conference.
Huang, H., Tutumluer, E., and Dombrow, W. (2009). “Laboratory Characterization of Fouled Railroad Ballast Behavior.” Transportation Research Record: Journal of the Transportation Research Board, 2117, 93–101.
Koohmishi, M., and Palassi, M. (2017). “Effect of particle size distribution and subgrade condition on degradation of railway ballast under impact loads.” Granular matter, Springer, 19(3), 63.
Nazarian, S., Yuan, D., and Williams, R. R. (2003). “A simple method for determining modulus of base and subgrade materials.” ASTM Special Technical Publication, 1437, 152–164.
NTSB. (2013). “National Transportation Safety Board Railroad Accident Brief: Metro-North Railroad Derailment.” <http://www.ntsb.gov/investigations/AccidentReports/Reports/RAB1411.pdf> (Jun. 1, 2016).
Parsons, R., Rahman, A., and Han, J. (2012). Properties of Fouled Railroad Ballast. Washington D.C.
Roberts, R., Rudy, J., and Gssi, S. (2006). “Railroad ballast fouling detection using ground penetrating radar. A new approach based on scattering from voids.” European Conference on Nondestructive Testing, 1(5).
Sadeghi, J., Motieyan-Najar, M. E., Zakeri, J. A., Yousefi, B., and Mollazadeh, M. (2018). “Improvement of railway ballast maintenance approach, incorporating ballast geometry and fouling conditions.” Journal of Applied Geophysics, Elsevier, 151, 263–273.
Selig, E. T., and Waters, J. M. (1994). Track geotechnology and substructure management. Thomas Telford.
Tamrakar, P. (2017). Evaluation of Mechanical Parameters of Contaminated Road Base and Railway Ballast. The University of Texas at El Paso.
Tamrakar, P., Azari, H., Yuan, D., and Nazarian, S. (2017a). “Implementation of spectral analysis of surface waves approach for characterization of railway track substructures.” Transportation Geotechnics.
Tamrakar, P., Nazarian, S., Garibay, J. L., and Azari, H. (2017b). “Feasibility of Impulse Response Test for Characterizing Railway Ballasts.” Journal of Materials in Civil Engineering, American Society of Civil Engineers, 30(2), 4017287.
[adsanity id=”96962″ align=”aligncenter”/]


