
Prajwol Tamrakar, Mark H. Wayne, and David J. White present field tests and results with Automated Plate Load Testing (APLT) to determine the permanent and resilient deformation behavior of pavement bases with and without geogrid stabilization. The full paper version of this article is available in the GAP 2019 transportation engineering conference proceedings. GAP was developed and managed by Minerva TRI, publisher of Geosynthetica.
- DEFORMATION BEHAVIOR INTRODUCTION
The demand for structural design and analysis of rigid and flexible pavements using the Mechanistic-Empirical (ME) approach has significantly increased in the last decade because of its advanced techniques of modeling and predicting performance of pavement system (Darter et al. 2005; Li et al. 2009; Tompkins et al. 2015; Wu et al. 2016). In 2002, the American Association of State Highway Transportation Officials (AASHTO) introduced the Mechanistic-Empirical Design Guide (MEPDG) to replace the 1993 AASHTO Guide for Design of Pavement Structures (Li et al. 2011). Some State DOTs also followed the path of AASHTO, and developed specifications and design packages based on the ME approach (e.g., Washington State DOT Pavement Guide, MnPAVE by Minnesota DOT, and CalME by California DOT). Pavement performances in the ME approach are predicted by estimating pavement layer deformations due to traffic load intensity, loading rate, mechanical properties of pavement layer, moisture level and foundation conditions.
Due to cyclic traffic loading, unbound pavement layers experience both permanent and resilient deformations (Tamrakar and Nazarian 2018). The rutting performance of the pavement is directly affected by the permanent deformation behavior. The resilient deformation of unbound pavement layers is responsible for maintaining the flexibility and stability of the pavement structure (Lekarp et al. 2000). Several field and laboratory-based testing methodologies are available to measure both permanent and resilient deformations (Tamrakar and Nazarian 2017). The laboratory testing, for example, AASTHO T 307, utilizes a small cylindrical specimen (150 mm in diameter and 300 mm in height) with confining pressures and repeated axial stresses to mimic a range of field conditions. Due to the lack of all pavement layers, such laboratory testing cannot truly represent the field conditions. On the other hand, the light weight deflectometer (LWD) and falling weight deflectometer (FWD) tests are conducted on the unpaved and paved pavement surfaces to measure the load-deformation responses.
Since impact loads are used during the LWD and FWD testing, the measured deformations are neither permanent nor resilient. As an alternative, static plate load testing (PLT) is also used in practice. However, such PLT can only measure permanent deformation due to a static load. Dynamic (repeated) load-deformation responses need to be recorded to better characterize traffic load-related behavior of a field constructed aggregate base course. In other words, a PLT with dynamic or repetitive loading conditions over a range of different stress levels is required to mimic field behavior. In response to this need an Automated Plate Load Testing (APLT) system has been developed with the capability to measure in-situ dynamic load-deformation responses through the application of various stress levels and loading cycles (White and Vennapusa 2017).
SEE ALSO: The Benefits of Accelerated Pavement Testing on Infrastructure
The aim of this paper is to evaluate permanent and resilient deformations of geogrid-stabilized and unstabilized pavement bases using the APLT system. Field tests were performed over the pavement aggregate base course (ABC) at two sites. Both ABCs were prepared with recycled materials. Permanent and resilient deformations were measured at constant and varying cyclic stress conditions using a 300 mm diameter plate.
- BASE COURSE STABILIZATION
Base course stabilization is the process of constructing a mechanically stabilized layer (MSL) with the use of geogrid. The term “stabilization” is different from “reinforcement” because the former one is referring to “stiffness enhancement” as well as “stiffness retention for a longer period”. In contrast, the term “reinforcement” implies “adding force” (Giroud and Han 2016). This mechanism is only effective if the forces are large which in turn implies that large vertical permanent deformations exist in the aggregate overlying the geogrid.
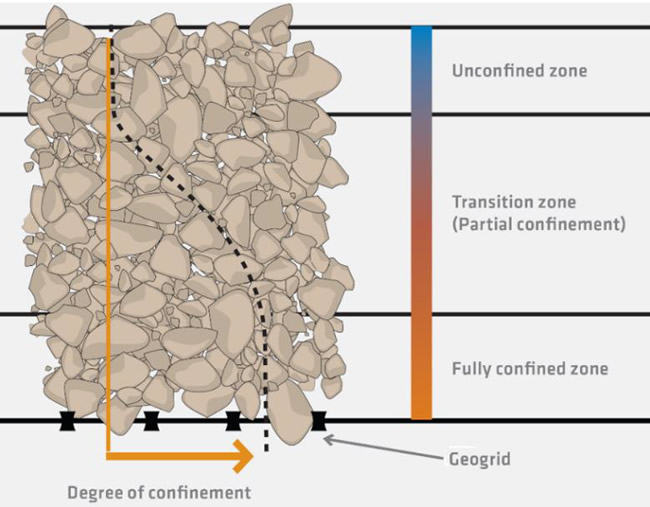
When a geogrid is incorporated into a granular material, the aggregate particles interlock with the geogrid and are confined within the geogrid apertures. As a result, the particles are restrained from moving laterally. The lateral restraint provided by the geogrid contributes to reducing induced strain due to traffic loading and thereby increases the stiffness of the granular layer (Wayne et al. 2013; Sun et al. 2018; Wayne et al. 2019). In addition to the lateral restraint, granular particles immediately adjacent to the interlocked particles are themselves restrained by particle to particle interlock. Thus the influence of the geogrid inclusion extends beyond the geogrid particle interface. Cook and Horvat (2014) demonstrated the existence of such variation in particle interlocking using a multi-level shear box. The authors found that the influence of the geogrid on the stiffness of a granular layer will decrease in relation to the distance from the geogrid. This can be represented as zones of confinement from fully confined to unconfined as illustrated in Figure 1. Behaviors of confinement due to different geogrid and material types were also investigated through the use of Discrete or Finite Element Modeling (Konietzky et al. 2004; McDowell et al. 2006; Stahl et al. 2014; Jas et al. 2015; Lees 2017).
- PROJECT DETAILS
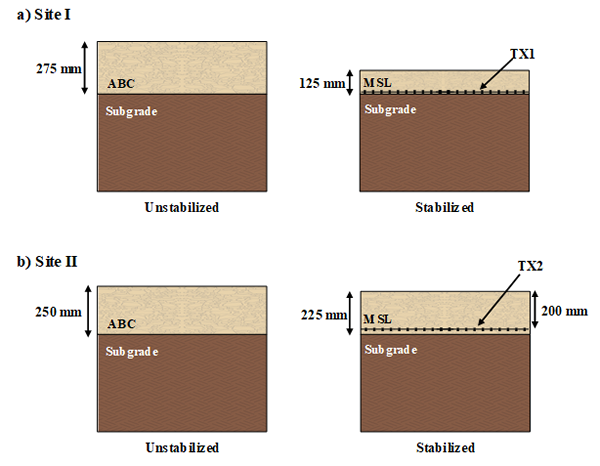
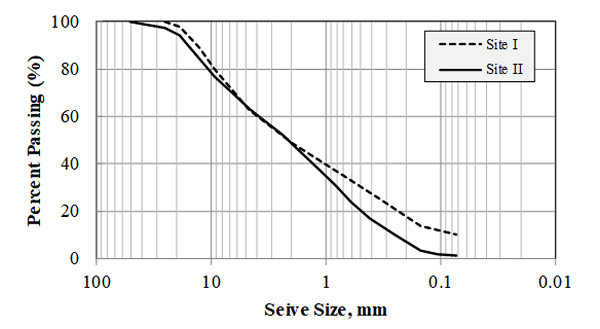
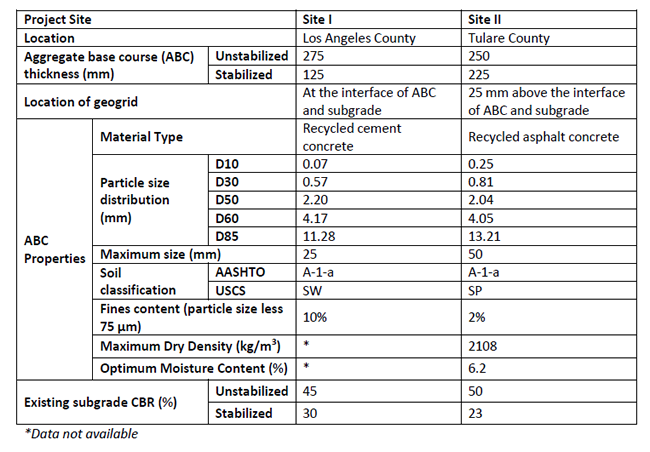
The project sites were located in Los Angeles County and Tulare County, CA. The first project site (Site I) was located at the south-bound lane of Interstate 5. The second site (Site II) was located at Avenue 144. For Site I, the stabilized pavement section consisted of 125-mm-thick ABC with a layer of geogrid at the base/subgrade interface. The properties of multi-axial geogrids are reported in Table 4. The unstabilized pavement section consisted of 275-mm-thick ABC. The ABC was prepared from recycled cement concrete material having maximum particle size of 25 mm. For Site II, the geogrid stabilized pavement section consisted of 225-mm-thick ABC with a layer of geogrid located near base/subgrade interface (see Figure 2). The ABC was prepared from recycled asphalt concrete material having a maximum particle size of 50 mm. Both sites consisted of firm subgrade (subgrade CBR >20%). Other details of ABC, including particle size distribution, are reported in Figure 3 and Table 5.

- TESTING PROTOCOL
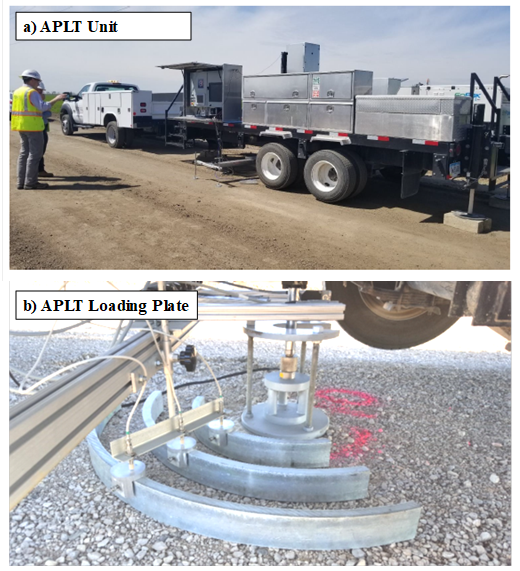
The APLT system (see Figure 4) consists of an advanced electronic-hydraulic control system for applying cyclic and static load pulses through circular steel plates and high-resolution sensors for measuring vertical ground displacements (White and Vennapusa 2017). Compared to FWD, the APLT has the advantage of applying a conditioning loading prior to testing and measuring peak, resilient and permanent deformations for each loading cycle. In this study, a 300 mm diameter plate was used to apply cyclic loads over ABC of geogrid-stabilized and unstabilized pavement sections. Each load cycle consisted of 0.2 second and 0.8 second of loading and resting periods. Tests were conducted at constant and varying stress conditions. For a constant stress condition, a total of 10,000 cyclic loads was applied and each load cycle consisted of a peak stress of 103 kPa. For the varying stress condition, 100 cyclic loads were applied at six different stress conditions as shown in Table 3.

Cumulative permanent deformation (𝛿p) measured using the constant stress condition can be represented by a power model as shown in equation 1. Monismith et al. (1975) described a similar power model relationship for relating permanent strain to cyclic loading for repeated triaxial laboratory testing.
𝛿p = 𝐶𝑁d (1)
where, coefficient C is the plastic deformation after the first cycle of repeated loading, and d is the scaling exponent.
This power model has been used to forecast the number of cycles required to achieve a selected permanent deformation. Further, the rate change of the permanent deformation can be used to estimate the post-compaction permanent deformation and the corresponding number of loading cycles.
MORE FROM GAP 2019: Assessment of Historical Army Airfield Pavement Condition Data
Post-compaction permanent strain is a function of the shear stress magnitude and can reach an equilibrium state following the shakedown concept (Dawson and Wellner 1999). In this study, a change in permanent deformation rate (Δδp/cycle) of 0.0025 mm/cycle or less was selected to represent the near-linear elastic condition. The number of cycles corresponding to Δδp of 0.0025 mm/cycle is referred to as N*, where the application of addition cyclic loadings results in very low accumulation of additional permanent deformation and the composite foundation layers are producing a resilient response.
- PRESENTATION OF RESULTS
Figure 5 presents the results of APLT conducted at the constant stress condition for the stabilized and unstabilized pavement sections of Site I. The solid lines in the figure represent permanent deformation (PD) experienced by the pavement sections at different loading cycles whereas the dotted lines represent the resilient deformation (RD). For both sections, the permanent deformation increased with increasing load cycles. The unstabilized section experienced approximately 4 times higher deformation than that for the stabilized section. A summary of permanent deformation test results is presented in Table 7. The table shows that N* values for the stabilized and unstabilized section are about 1.6k and 12.5k cycles, respectively. This fact indicates that the geogrid-stabilized pavement section exhibits a full resilient response at the early stages of loading. Ideally this early stage loading is completed during the construction process and prior to placement of the overlying concrete or asphalt.
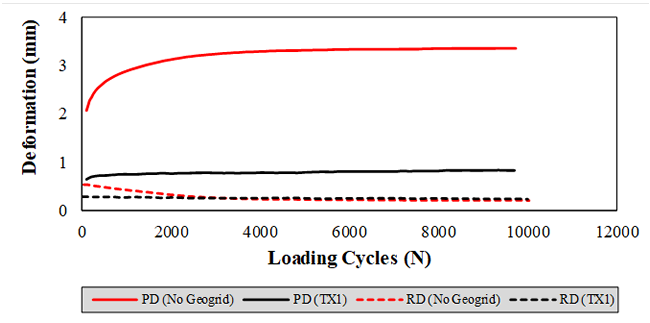
Although the results showed a difference in the permanent deformation for the unstabilized and stabilized sections, the resilient deformations were similar except for the initial loading cycles (<2000 loading cycles). Overall, the resilient deformation for both sections was similar despite of thicker unstabilized ABC and thinner stabilized ABC.
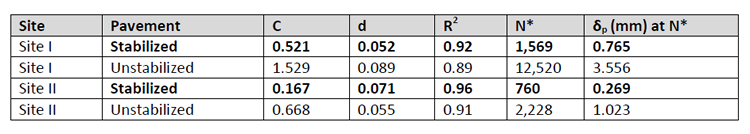
Figure 6 shows permanent and resilient deformations experienced by the pavement sections during the test conducted at the constant stress condition for Site II. Like Site I, the stabilized section also showed resistance against permanent deformation. However, the magnitude of deformations was less than those for the Site I. For Site II, the unstabilized section experienced approximately 4.4 times more deformation than the stabilized section. Overall resilient deformation for both sections was similar. Table 7 shows that N* values for the stabilized and unstabilized section are about 760 and 2228 cycles, respectively.
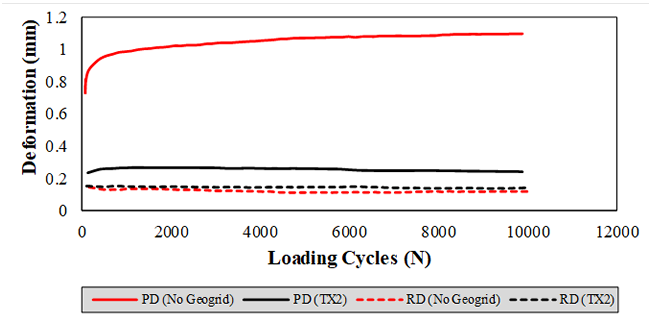
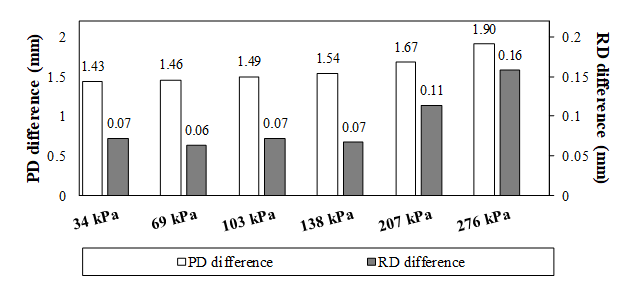
Figure 7 presents the results of APLT conducted at the varying stress condition for Site I. Permanent deformation increased with both loading cycles and the stress level. Figure 8 shows the difference in permanent deformation between the stabilized and unstabilized sections at different stress levels. Up to a stress level of 138 kPa, the average difference in permanent deformation was 1.48 mm. Differences in permanent deformation at a stress level of 207 kPa and 276 kPa were 1.67 mm and 1.90 mm, respectively. Compared to the average deformation of 1.48 mm (i.e., at the stress level ≤ 138 kPa), the deformation at 207 kPa and 276 kPa increased by 13% and 28%. This fact indicates that the geogrids contribute in reducing permanent deformation at the higher stress levels.
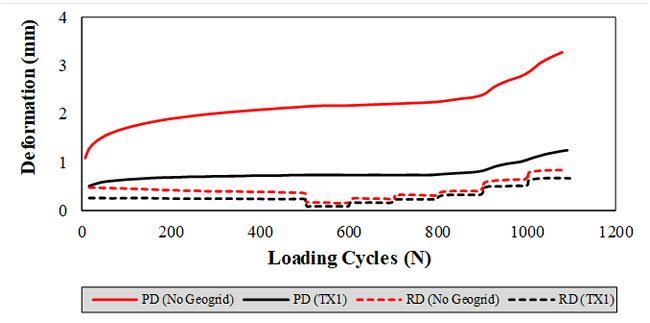
Figure 7 shows the resilient deformation for the stabilized section is slightly lower than that for the unstabilized section of Site I. The difference in resilient deformation between the stabilized and unstabilized section is also reported in Figure 8. The pattern of resilient deformation difference was also like the pattern of permanent deformation difference. However, the magnitude of deformation difference was considerably low, indicating that the thinner stabilized ABC and thinner unstabilized ABC possess similar resilient characteristics at different stress levels.
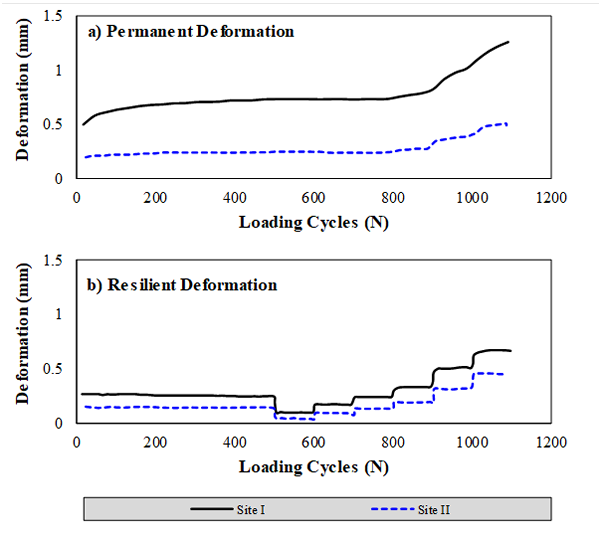
For Site II, the APLT testing at varying stress states was conducted only for the stabilized section. Therefore, it was not possible to compare deformation differences at different stress levels for the stabilized and unstabilized sections. Instead, the permanent and resilient deformations measured at varying stress states for Site I and Site II are compared in Figure 9. Both permanent and resilient deformations for Site I are slightly higher than that for Site II, and both sites show a similar pattern of increase in deformation with loading cycles and stress levels.
The average difference in permanent deformation up to the stress level of 138 kPa was 0.49 mm. The deformation difference above the stress level 138 kPa was 0.63 mm. Similarly, the average resilient deformation difference at all stress levels was 0.13 mm. Although the stiffness of subgrade for Site I is greater than Site II, Site II exhibited better performance over Site I.
Several factors such as aggregate material type, aggregate gradation, ABC layer thickness, and geogrid type might have contributed to such difference in performance.
- DEFORMATION BEHAVIOR SUMMARY
To evaluate permanent and resilient deformation behavior of geogrid-stabilized and unstabilized pavement sections, a series of field tests was conducted using the Automated Plate Load Testing (APLT) system. The pavement aggregate bases were prepared from either recycled cement concrete or recycled asphalt concrete. Two types of multi-axial geogrids were considered for the study. Permanent and resilient deformations were measured at constant and varying cyclic stress conditions using a 300 mm diameter plate. Based on this research, the following conclusions can be drawn:
- Permanent and resilient deformations are directly affected by the number of loading cycles and the stress levels.
- On performing APLT at the constant stress condition, the unstabilized section experiences approximately 4 times greater deformation than the geogrid-stabilized section.
- When the aggregate base course is prepared from the recycled cement concrete, the thicker unstabilized section and thinner stabilized section exhibit similar resilient deformations.
- The difference in permanent deformation between the stabilized and unstabilized sections increases with the increase in the stress level, indicating that the geogrids contribute in reducing permanent deformation at the higher stress levels.
- Geogrids improve performance of aggregate base course prepared with recycled materials.
- The number of cycles corresponding to Δδp of 0.0025 mm/cycle is referred to as N*, where the application of addition cyclic loading results in very low accumulation of additional permanent deformation and the composite pavement foundation produces a resilient response. The N* cycles were 87.5% and 66% less for the stabilized versus unstabilized sections for Site I and Site II respectively. This fact indicates that the geogrid-stabilized pavement sections exhibit a full resilient response at the early stages of loading. Future research should examine whether a correlation exists between pavement performance and low N* values.
Prajwol Tamrakar and Mark Wayne work for Tensar International Corporation. David White works for Ingios Geotechnics.
REFERENCES
Cook, J., and Horvat, F. (2014). “Assessment of particle confinement within a mechanically stabilized layer.” 10th International Conference on Geosynthetics. Berlin.
Darter, M., Khazanovich, L., Yu, T., and Mallela, J. (2005). “Reliability Analysis of Cracking and Faulting Prediction in the New Mechanistic–Empirical Pavement Design Procedure.” Transportation research record, SAGE Publications Sage CA: Los Angeles, CA, 1936(1), 150–160.
Dawson, A. R., and Wellner, F. (1999). “Plastic behavior of granular materials.” Final report ARC project, 933.
Giroud, J. P., and Han, J. (2016). “Mechanisms governing the performance of unpaved roads incorporating geosynthetics.” Geosynthetics, 34(1).
Jas, H., Stahl, M., te Kamp, L., Konietzky, H., and Oliver, T. (2015). “Discrete element simulation: Modelling and analysis of a geogrid stabilized sub-base while loaded with a moving wheel.” XVI European Conference on Soil Mechanics and Geotechnical Engineering.
Konietzky, H., te Kamp, L., Groeger, T., and Jenner, C. (2004). “Use of DEM to model the interlocking effect of geogrids under static and cyclic loading.” Numerical modeling in micromechanics via particle methods, AA Balkema, Rotterdam, 3–12.
Lees, A. (2017). “Simulation of geogrid stabilization by finite element analysis.” Proceedings of 19th International Conference on Soil Mechanics and Geotechnical Engineering, Seoul, 1377–1380.
Lekarp, F., Isacsson, U., and Dawson, A. (2000). “State of the art. I: Resilient response of unbound aggregates.” Journal of Transportation Engineering, 126(1), 66–75.
Li, J., Pierce, L. M., and Uhlmeyer, J. (2009). “Calibration of flexible pavement in mechanistic—empirical pavement design guide for Washington state.” Transportation Research Record, SAGE Publications Sage CA: Los Angeles, CA, 2095(1), 73–83.
Li, Q., Xiao, D. X., Wang, K. C. P., Hall, K. D., and Qiu, Y. (2011). “Mechanistic-Empirical Pavement Design Guide (MEPDG): a bird’s-eye view.” Journal of Modern Transportation, Springer, 19(2), 114–133.
McDowell, G. R., Harireche, O., Konietzky, H., Brown, S. F., and Thom, N. H. (2006). “Discrete element modelling of geogrid-reinforced aggregates.” Proceedings of the Institution of Civil Engineers- Geotechnical Engineering, Thomas Telford Ltd, 159(1), 35–48.
Monismith, C. L., Ogawa, N., and Freeme, C. R. (1975). “Permanent deformation characteristics of subgrade soils due to repeated loading.” Transportation Research Record, (537).
Stahl, M., Konietzky, H., Te Kamp, L., and Jas, H. (2014). “Discrete element simulation of geogrid stabilized soil.” Acta Geotechnica, Springer, 9(6), 1073–1084.
Sun, X., Han, J., Parsons, R. L., and Thakur, J. (2018). “Equivalent California Bearing Ratios of Multiaxial Geogrid-Stabilized Aggregates over Weak Subgrade.” Journal of Materials in Civil Engineering, American Society of Civil Engineers, 30(11), 4018284.
Tamrakar, P., and Nazarian, S. (2017). “Comparison of Laboratory and Field Test Results for Granular Bases.” Geotechnical Frontiers, 384–392.
Tamrakar, P., and Nazarian, S. (2018). “Evaluation of plate load based testing approaches in measuring stiffness parameters of pavement bases.” Transportation Geotechnics, 16.
Tompkins, D., Johanneck, L., and Khazanovich, L. (2015). “State design procedure for rigid pavements based on the AASHTO mechanistic–empirical pavement design guide.” Transportation Research Record, SAGE Publications Sage CA: Los Angeles, CA, 2524(1), 23–32.
Wayne, M., Fraser, I., Reall, B., and Kwon, J. (2013). “Performance verification of a geogrid mechanically stabilized layer.” The 18th International Conference on Soil Mechanics and Geotechnical Engineering, Paris, 1381–1384.
Wayne, M. H., Fountain, G., Kwon, J., and Tamrakar, P. (2019). “Impact of Geogrids on Concrete Highway Pavement Performance.” Geosynthetics Conference.
White, D. J., and Vennapusa, P. K. R. (2017). “In situ resilient modulus for geogrid-stabilized aggregate layer: A case study using automated plate load testing.” Transportation Geotechnics, Transportation Geotechnics, 11, 120–132.
Wu, Z., Xiao, D. X., and Zhang, Z. (2016). “Research Implementation of AASHTOWare Pavement ME Design in Louisiana.” Transportation Research Record, SAGE Publications Sage CA: Los Angeles, CA, 2590(1), 1–9.


