
Dr. Stacey Kulesza, P.E., Robert Sherwood, and Dr. Michelle Berry, P.E. exam fouled ballast and soil-water characteristic curves, in this latest share from the GAP 2019 transportation engineering conference proceedings (Colorado Springs, November 2019). Geosynthetica published the proceedings. The team’s research is extremely valuable, as ballast fouling can impact the safety and performance of railway tracks. The work also exemplifies one of the hallmarks of the railroad industry: it succeeds through a strong partnership between public and private research, threading safety and long-term performance into all manners of monitoring and operations.
The primary research in this article was funded by the Federal Railroad Administration (FRA) Broad Agency Announcement. The contents of this paper reflect the views of the authors and do not necessarily reflect the official view of FRA. The authors would also like to thank BNSF Railway, which served as a project partner through the donation of samples.
1. INTRODUCTION TO FOULED BALLAST
In the field, ballast is an unsaturated porous media, with both air and water in the particle pore space. Strength, deformation, and fluid flow behavior in unsaturated media are complex functions of material properties (particle and pore size), particle angularity, degree of saturation, pore air and pore water pressure (suction), and liquid-air interface properties (Fredlund et al. 1978; Lu and Likos 2006). Ballast fouling, i.e., the increase in small particles from degradation of the ballast, infiltration of external fine particles such as coal dust, and pumping of the subgrade material over time (Selig and Waters 1994), alters ballast physical properties. Depending on the pore size distribution, or more specifically the degree of fouling in the pore space, ballast water holding capacity changes from its designed free-draining condition and its strength is reduced (e.g., Selig and Waters, 1994; Han and Selig, 1997).
Many researchers have studied the impact of different particle size distribution and fouling material on ballast strength (e.g., Indrarantra et al., 1998; Qian et al., 2016; Ishikowa et al., 2016; Kashani et al., 2018). Because this reduced strength impacts track performance and safety, track inspections are routinely conducted with various visual and nondestructive methods. One promising nondestructive method is ground penetrating radar (GPR) (e.g., Anbazhagan et al., 2016; Leng and Al-Quadi, 2010; Sussman et al., 2003). GPR measurements are dependent on the dielectric constant which is a function of many material properties; however, it is primarily a function of the material volumetric moisture content (Daniels, 2004). Roberts et al. (2009) identified a nearly linear relationship between moisture content and fouling index (i.e., higher moisture content meaning higher fouling); however, they noted that both fouling and moisture increased dielectric properties, at different degrees, and the relative influence due to moisture alone versus fouling could not be determined. In most of the documented shear strength studies and GPR studies, the ballast moisture contents have either been at the extremes (i.e., dry or fully saturated) or evaluated at arbitrary points between these extremes. There is a need to fully understand the role of moisture content versus the degree of fouling on ballast to characterize the strength and deformation as well as to improve GPR reliability in identifying fouled ballast.
RELATED: Geosynthetics in Diverse Railroad Applications
Soil Water Characteristic Curves (SWCCs) are well established principles, originally developed in soil physics for soil-water-plant systems (Buckingham, 1907). Soil suction relates the moisture condition of soil to its changing engineering behavior in unsaturated conditions. SWCCs measure the change in suction over a range of water contents between the minimum and maximum water holding capacity of a porous media. Previous researchers have not measured how the water holding capacity (and related suction) changes with increased fouling. The objectives of this study are to measure the SWCC of fouled ballast and identify how the percentage of fouling changes ballast SWCCs. The long-term goal of this research is to understand fouled ballast characteristics (i.e., strength, water holding capacity, and dielectric constant) as a function of the percentage of fouling. Previous researchers have established a relationship between dielectric constant and SWCCs (Sahin et al. 2016). Therefore, understanding the SWCC of fouled ballast is critical to determine the relevant contribution of fouling versus increased moisture on the change in dielectric constant measured with GPR. The inherent uncertainty of current GPR methods to identify fouled ballast will be reduced with a greater understanding of material characteristics as a function of moisture.
2. MATERIALS AND METHODS
2.1 Ballast Samples
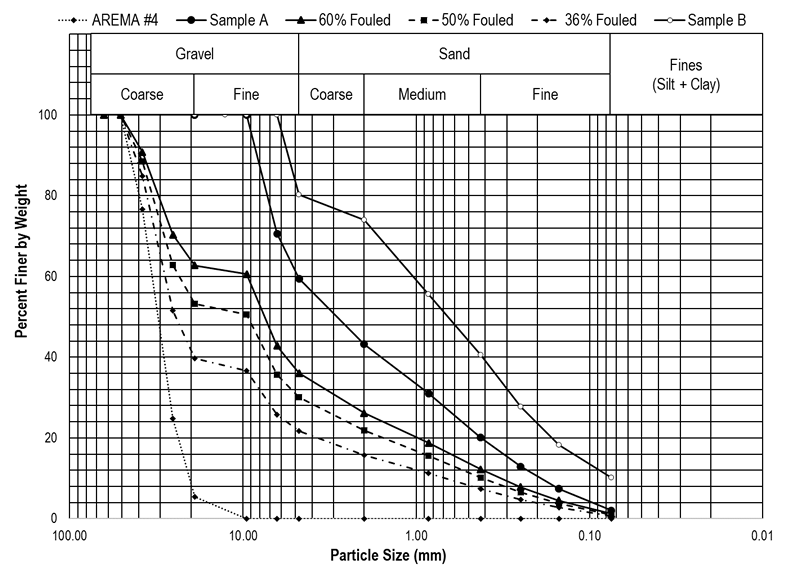
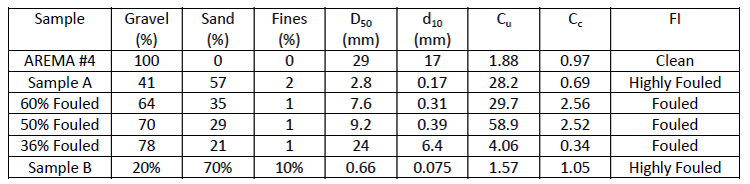
The clean ballast used in this study was granitic (igneous intrusive) ballast from a quarry in Oklahoma mixed to meet American Railway Engineering and Maintenance-of-Way Association (AREMA) #4 gradation (AREMA, 2019). The clean ballast is noted as AREMA #4. Two processed fouled ballast samples were collected from mainline track in the Midwest, noted as Samples A and B. These samples were washed and then sieved following ASTM C136 (ASTM 2014) and ASTM D422 (ASTM 2007) and only the material that passed the 3/8 sieve was kept. Note that washing the samples removed the fines (i.e., material that passed the No 200 sieve); however these materials were donated after washing and sieving the ballast during inspections. Additional fouled ballast samples were made by mixing the AREMA #4 ballast and Sample A to different percentages of fouled material by mass.
All laboratory prepared samples classified as fouled based on the Selig and Waters (1994) fouling index,
![]()
where P4 is the percentage of material by mass that passes the No 4 sieve (4.75 mm) and P200 is the percentage of the material that passed the No 200 sieve (0.075 mm). The AREMA #4 ballast classified as clean and Samples A and B were highly fouled based on the fouling index. The AREMA #4 ballast classified as poorly-graded gravel (GP) according to the Unified Soil Classification System (ASTM D2487).
Samples A and B classified as poorly-graded sand with gravel (SP). The 60% and 50% fouled samples classified as well-graded gravel with sand (GW). The 36% fouled sample classified as GP with sand. The sand fractions of the prepared samples and Sample A were primarily coarse and medium sand. The sand fraction of Sample B was primarily medium and fine sand. The particle size distribution curves of all materials are are shown in Figure 1. All samples had negligible fines, likely due to the washing of the fouled samples. Material properties, including particle classification based on ASTM D2487 and grain size distribution characteristics, are shown in Table 1.
2.2 Soil Water Characteristic Curves
SWCC were measured for the processed fouled materials (i.e., Samples A and B) using the transient release and imbibitions method developed by Wayllace and Lu (2012). The K-State device uses a 62 mm diameter cell with a 300 kPa high air entry pressure ceramic disk. No particles were larger than 10.3 cm, or one-sixth the cell diameter, following accepted practice leading to negligible scaling effects (Marachi et al., 1972; ASTM 2016). Samples were oven dried and 170 g were placed in the cell. Light tamping was used in layers to ensure uniform density and consistent sample height. Samples were saturated through the bottom of the cell under a vacuum at the top of the cell. Two pressure increments are applied using axis translation in the transient water release and imbibitions method. The water transient outflow or imbibition from the sample in response to the applied pressure is measured. The outflow is then used as an objective function for an inverse model to determine the hydrologic parameters needed to create a SWCC. The van Genuchten (1980) model was used to create the SWCCs herein as it is widely used in practice and appropriately fits most SWCC data. Equation 2 shows the van Genuchten model, which relates volumetric water content and matric suction in soil, based on Mualem (1976),
where θs is the saturated volumetric water content, θr is the residual water content, is matric suction, and α, n, and m are empirical fitting parameters. Specifically, α is the inverse of the air entry value in the sample, n is the pore size distribution parameter, and m is (1-1/n). The saturated and residual water contents were calculated based on weight-volume relationships and measured be the beginning and end of each TRIM test.
The SWCC from Sample A was then used to calculate the SWCC of laboratory prepared ballast with target percentages of fouling using the Bouwer and Rice (1984) correction. These laboratory prepared ballast samples were created by mixing the AREMEA #4 ballast with a target amount of Sample A.
Special care was taken to ensure the density of the fouling material in the prepared samples matched the density of Sample A in the transient release and imbibitions method cell. Bareither and Benson (2013) evaluated the Bouwer and Rice (1984) correction for samples with larger (i.e., gravel sized) particles and noted that the dry density of the finer fraction (Sample A) must match the dry density of the finer faction in the bulk samples (laboratory prepared samples) to use the correction. Although the goal was to create samples in three fouling index levels, it was not possible to create a moderately fouled or moderately clean sample while maintaining the dry density of the fouling material at the same level as Sample A. The lowest achievable fouling index was 22 (fouled), in the 36% fouled sample. The Bouwer and Rice (1984) correction was required because the current cell diameter cannot accommodate the larger ballast aggregates and still meet the one-sixth particle to cell diameter ratio. A larger cell is currently being to validate the results presented herein. Bower and Rice (1984) established that bulk soil volumetric water content, θb, can be computed from the volumetric water content of a finer fraction (i.e., with larger particles excluded) by
![]()
where VR is the volume fraction of larger particles in the total soil sample and θf is the volumetric water content of the finer soil fraction. In this study, θf is the fouled ballast measured in the transient release and imbibitions method cell and θb is the laboratory prepared sample with AREMA #4 ballast and Sample A. Therefore, theoretical SWCC of the three laboratory prepared samples were created by applying Equation 3 to the measured SWCC of the processed fouled ballast.
3. RESULTS AND DISCUSSION
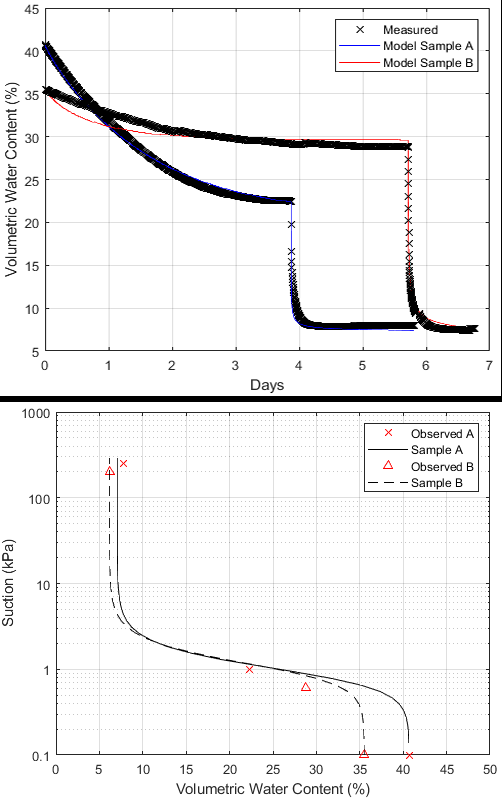
Figure 2 shows the results from Samples A and B. Figure 2a is the measured and modeled water outflow. The Sample A model very nearly fit the measured data with an R-squared for the regression of predicted versus observed of 0.997 and Sample B had an R-squared of 0.996 indicating good fit in the inversions for the SWCCs shown in Figure 2b. The observed data in Figure 2b were the saturated volumetric water content before applying suction, the measured volumetric water content at the low suction increment, and the measured residual volumetric water content at the high suction increment. These SWCCs represent the worst case scenario, in which only the processed fouled materials (i.e., no aggregates larger than the 3/8 sieve) were measured. For example, as the Sample A matric suction in Figure 2b passed the air entry value, there is a relatively large range of volumetric water contents where the suction minimally increases (from approximately 0.4 to 4 kPa) until the residual water content is reached. This indicated that there was a large range of water holding capacity in the fouled material.
Note that the low suction increment (1 kPa) was selected as suction near typical air entry value for poorly graded sand, but because there was an 18% difference in volumetric water content between fully saturated and the volumetric water content at 1 kPa, this initial suction was likely too high. Despite the higher first increment in Sample A, there was still high fit of the measured/modeled outflow and fit between the observed and modeled SWCC. Sample B was run at a low suction increment of 0.5 kPa, however no outflow was observed so the suction was increased to 0.6 kPa. This lead to outflow and was slightly higher than the air entry value as desired. Note that the SWCC shapes are similar, however the water holding capacity of sample B was lower than A. The shape and range of matric suction and volumetric water content are similar to SWCCs for poorly graded sand with gravel in both samples (Yang et al. 2004; Fredlund et al. 2012).
To simulate a fouled SWCC with ballast aggregate, the Sample A SWCC in Figure 2b was corrected following the Bouwer and Rice (1984) and with the fouled ballast samples at the gradations shown in Figure 1 and Table 1. These samples were made with a clean/fouled ballast mixture such that the sample contained 60%, 50%, and 36% fouling material by mass. Note that the inclusion of the clean ballast changed the USCS classification from sand with gravel to gravel with sand. The range of suction and volumetric water content of the SWCCs in Figure 3 are similar to previous studies on gravel (Li and Zhang 2007; Ba et al. 2013). In Figure 3, all corrected SWCCs compared to the Sample A SWCC shifted to the left, as expected from the correction. The 60% fouled sample had a theoretical saturated volumetric water content of 29.6% from the correction and a calculated saturated volumetric water of 30%, based on soil properties, indicating close agreement for the correction. The 50% fouled and 36% fouled samples were similarly within 2% comparing the calculated volumetric water content and the saturated volumetric water content from the correction. As the percentage of fouling material relative to the ballast decreased, so did the saturated volumetric water content and residual water content, though the decrease in residual water content was relatively lower. In the 35% fouled sample, the volumetric water content at 1 kPa suction was 12% whereas the measured volumetric water content at 1 kPa in Sample A was 22%. Also, as the percent fouling increased, the range of volumetric water content increased. For example, in the 36% fouled sample, the volumetric water content at 0.4 kPa was 20% and 3.6% at 4 kPa.
In the 60% fouled sample, the volumetric water content was 29% at 0.4 kPa and 5% at 4 kPa. Thus, the 67% increase in fouled materials increased the water holding capacity of the ballast by 46% over the same range of matric suction. The relationship between the increased percentage of fouling and increased saturated volumetric water content supports the findings of Roberts et al. (2009). The results in Figure 3 also highlight that not only does the saturated volumetric water content increase with fouling but the range of water holding capacity (i.e., between residual and saturated) increases with fouling.

The SWCCs in Figure 2 highlight how ballast samples that classify the same according to the USCS system and have the same fouling index classification may still have different water holding capacity. Figure 3 shows how the percentage of ballast fouling impacts ballast water holding capacity (and suction). The samples with only fouled ballast materials had a higher residual water content, meaning more water is trapped in the pore space at the end of drying compared to samples with ballast aggregate. Note that there is extremely limited water holding capacity in clean ballast as it is intended to be free draining.
These results highlight that as the percentage of fouling increases, so does the water holding capacity of the ballast and over a wide range of volumetric water contents. Because GPR is primarily controlled by the dielectric constant, this wide band of volumetric water content over a relatively low range of suctions may explain why GPR results can be highly variable with in situ moisture conditions. In other words, there may be a wide range of potential moisture contents within very similar in situ ballast conditions that are impacting the GPR interpretations.
MORE GAP: Implementing Geotechnical Asset Management
Furthermore, it is well established that fouled ballast and the associated reduced drainage hinders the transfer of the load from the wheels to the supporting substructure (Armstrong 2008). This rapidly deteriorates the rail support structure and increases the likelihood of failure. In extreme cases, when not remediated, fouled ballast can lead to train derailment. However, there has been much anecdotal evidence gathered in talking with field engineers that there are areas that continually become fouled, but show no deterioration of the track substructure. In order for a method to nondestructively identify all fouled ballast successfully, the characteristics of the fouled material must be understood. Because suction directly relates the water content of a material to its engineering behaviors, the next steps of this research will be to measure the fouled ballast strength, at target volumetric water contents identified from the measured SWCCs between residual and saturated volumetric water contents. The strength testing will contribute to the fundamental understanding of the characteristics of fouled ballast as a function of water content and suction to fully understand the material properties and how this relates to in situ behavior
The theoretical SWCC of clean ballast (i.e., with no fouling) would be a nearly flat line with very small difference in suction at the saturated and residual volumetric water contents. This study was limited because it was not possible to make samples with lower degrees of fouling at the same fouling material density with the current experimental set up, therefore the next step of this research is to increase the size of the cell to measure the SWCC of fouled ballast. This will validate the corrected curves presented herein and allow for direct measurements at lower degrees of fouling. The findings herein are also limited by the number of samples and grain size distributions. The SWCCs of additional fouled materials with more fines and with different parent fouling materials, such as coal dust, rather than the breakdown of ballast, are also currently being measured.
4. CONCLUSIONS
The findings presented in this paper show that increasing the percent fouling increases the water holding capacity of ballast with relatively small changes in ballast suction. The SWCCs of two fouled ballast samples were measured and theoretical SWCC of ballast at different percentages of fouling were created. There is very limited information regarding the SWCC of ballast, specifically related to the degree of fouling. Understanding the SWCC of fouled ballast is critical to determine the relevant contribution of the fouling material versus the contribution of moisture content on the dielectric constant. By understanding these variables, the uncertainty of nondestructive methods, such as GPR, to identify fouled ballast may be reduced, ultimately improving the effectiveness of track performance and safety inspections.
ACKNOWLEDGEMENTS
This research was funded by the Federal Railroad Administration (FRA) Broad Agency Announcement. The contents of this paper reflect the views of the authors and do not necessarily reflect the official view of FRA. The authors would like to thank our project partner, BNSF Railway Company, for donating the samples.
ABOUT THE AUTHORS
Dr. Stacey Kulesza, P.E. and Robert Sherwood are with Kansas State University, Dept. of Civil Engineering. Dr. Michelle Berry, P.E. is with the University of Arkansas, Dept. of Civil Engineering.
REFERENCES
Anbazhagan, P., Dixit, P.S.N., Bharatha, T.P. (2016). “Identification of type and degree of railway ballast fouling using group coupled GPR antennas.” Journal of Applied Geophysics, 126: 183-190.
AREMA. (2019). Manual for Railway Engineering. American Railway Engineering & Maintenance-of-way Assoc.
ASTM International. (2014). “ASTM C136/C136M-14 Standard Test Method for Sieve Analysis of Fine and Coarse Aggregates.” West Conshohocken, PA; ASTM International.
ASTM International. (2007). “ASTM D422-63 Standard Test Method for Particle Size Analysis of Soils.” West Conshohocken, PA; ASTM International.
ASTM International. (2016). “ASTM D5084-16a Standard Test Methods for Measurement of Hydraulic Conductivity of Saturated Porous Materials Using a Flexible Wall Permeameter.” West Conshohocken, PA; ASTM International.
ASTM International. (2017). “ASTM D2487-17 Standard Practice for Classification of Soils for Engineering Purposes (Unified Soil Classification System).” West Conshohocken, PA; ASTM International.
Bareither, C. and Benson, C. (2013). “Evaluation of Bouwer-Rice Large-Particle Correction Procedure for Soil Water Characteristic Curves.” Geotechnical Testing Journal, 35:5, 1-15.
Ba, M., Nokkaew, K., Fall, M., and Tinjum, J. (2013). Effect of Matric Suction on Resilient Modulus of Compacted Aggregate Base Courses.” Geotechnical and Geological Engineering, 31:5, pgs
Bouwer, H. and Rice, R. (1984). “Hydraulic properties of stony vadose zones.” Groundwater, 22:6, 696- 705.
Buckingham, E. (1907). “Studies of the movement of soil moisture.” Bulletin No. 38, U.S. Department of Agriculture, Bureau of Soils, Washington, DC.
Daniels, D.J. (2004). Ground penetrating radar, Institution of Electrical Engineers.
Fredlund, D. G., Morgenstern, N. R., and Widger, R. A. (1978). “Shear strength of unsaturated soils.” Can. Geotech. J., 15(3), 313 – 321.
Fredlund, D., Rahardjo, H. and Fredlund, M. (2012). Unsaturated soil mechanics in engineering practice. John Wiley & Sons. New York, NY.
Han, X. and Selig, E. (1997). “Effects of Fouling on Ballast Settlement.” Proceedings of the 6th International Heavy Haul Railway Conference.
Indraratna, B., Ionescu, D., Christie, H. (1998). “Shear behavior of railway ballast based on large-scale triaxial tests.” J. Geotech. Geoenviron. Eng. 124 (5), 439–449.
Ishikawa, T., Fuku, S., Nakamura, T., Momoya, Y., and Tokoro, T. (2016). “Influence of water content on shear behavior of unsaturated fouled ballast.” Procedia Engineering, 143, 268-275.
Kashani, H., Ho, C., Hyslip, J. (2018). “Fouling and water content influence on ballast deformation properties.” Construction and Building Materials, 190, 881-895.
Leng, Z. and Al-Qadi, I. (2010). “Railroad Ballast evaluation using ground-penetrating radar.” Transportation Research Record: Journal of the Transportation Research Board, No. 2159, 110- 117.
Lu, N. and Likos, W. (2006). “Suction stress characteristic curve for unsaturated soil.” J. Geotech. Geoenviron. Eng., 132(2), 131.
Marachi, N. D., Chan, C. K., and Seed, H. B. (1972). “Evaluation of properties of rockfill materials.” J. Soil Mech. and Found. Div., ASCE, 98,95-114
Mualem, Y. (1976). “Hysteretical models for prediction of the hydraulic conductivity of unsaturated porous media.” Water Resources Researrch, 12:6, 1248-1254.
Qian, Y., Mishra, D., Tutumluer, E., Hashash, Y., Ghaboussi, J. (2016). “Moisture Effects on Degraded Ballast Shear Strength Behavior.” Proceedings of the Joint Rail Conference, Columbia, SC.
Roberts, R., Al-Qadi, I., Tutumluer, E., Boyle, J. (2009). “Subsurface evaluation of railway track using ground penetrating radar.” U.S. Department of Transportation, FRA.
Sahin, H., Gu, F., Epps, J. and Lytton, R. (2016). “New method to estimate suction and moisture content of unbound aggregate base material in the field.” Transportation Research Board 2016 Annual Meeting, TRB
Selig, E.T and Waters, J.M. (1994). Track geotechnology and substructure management. London: Thomas Telford LTD
Sussman, T., Selig, E., Hyslip, J. (2003). “Railway track condition indicators from ground penetrating radar.” NDT& Int, 36: 157-167.
van Genuchten, M. T. (1980). “A closed-form equation predicting the hydraulic conductivity of unsaturated soils.” Soil Sci. Soc. Am. J., 44, 892.
Wallyace, A. and Lu, N. (2012). “A transient water release and imbibitions method for rapidly concurrent measurements of soil-water retention, hydraulic conductivity, and suction stress functions under drying and wetting conditions.” Geotech. Test. J., 35:1, 40-54.
Yang, H., Rahardja, H., Leong, E., and Fredlund, D. (2004). “A study of infiltration on three sand capillary barriers.” Canadian Geotechnical Journal, 41, 629-643.


